
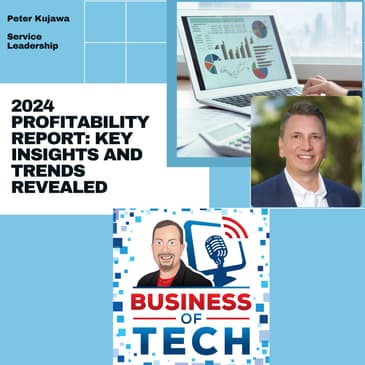
this episode, Peter Kujawa joins Dave Sobel to discuss the recently released Service Leadership Profitability Report. The conversation delves into various aspects of profitability, comparing different business models, and highlighting trends within the industry. The report provides valuable insights for MSPs and IT service providers, especially as they gear up for year-end planning.
One key finding discussed in the episode is the correlation between customer satisfaction and financial performance. The data reveals that the highest profitability customers also tend to have the happiest customers, emphasizing the importance of quality service delivery and pricing strategies. The discussion goes deeper into analyzing the relationship between Net Promoter Scores and service gross margins, shedding light on the nuances of customer satisfaction and profitability.
Another interesting topic explored in the episode is the comparison between private equity-backed MSPs and non-private equity-backed peers. The data suggests that private equity-backed MSPs generally exhibit higher Net Promoter Scores, indicating a positive impact on performance. Additionally, the episode touches on the financial performances across different geographic regions, highlighting operational maturity levels and profitability variations.
The episode also delves into the emergence of new providers in the industry and the evolving business models within the MSP space. Insights are shared on the importance of maintaining a healthy mix of services, including managed services, project services, and transactional IT, to drive overall business success. The discussion emphasizes the need for providers to understand the opportunities presented by Best in Class performance and the implementation of hyper-automation for transformative results.
💼 All Our Sponsors
Support the vendors who support the show:
👉 https://businessof.tech/sponsors/
🚀 Join Business of Tech Plus
Get exclusive access to investigative reports, vendor analysis, leadership briefings, and more.
👉 https://businessof.tech/plus
🎧 Subscribe to the Business of Tech
Want the show on your favorite podcast app or prefer the written versions of each story?
📲 https://www.businessof.tech/subscribe
📰 Story Links & Sources
Looking for the links from today’s stories?
Every episode script — with full source links — is posted at:
🎙 Want to Be a Guest?
Pitch your story or appear on Business of Tech: Daily 10-Minute IT Services Insights:
💬 https://www.podmatch.com/hostdetailpreview/businessoftech
🔗 Follow Business of Tech
LinkedIn: https://www.linkedin.com/company/28908079
YouTube: https://youtube.com/mspradio
Bluesky: https://bsky.app/profile/businessof.tech
Instagram: https://www.instagram.com/mspradio
TikTok: https://www.tiktok.com/@businessoftech
Facebook: https://www.facebook.com/mspradionews
Hosted by Simplecast, an AdsWizz company. See pcm.adswizz.com for information about our collection and use of personal data for advertising.
[00:00:02] Well, it's that time of year again. The Service Leadership Profitability Report is out and Peter Kujawa joins me to talk about it.
[00:00:09] We dive into profitability, we compare business models, we talk about some of the trends, we talk succession, and we talk even more in this bonus episode of the Business of Tech. Looking to reach an audience of thousands of MSPs and IT service providers?
[00:00:24] Put your ad right here on the Business of Tech and be on the show that 64% of MSPs report having listened to. A recurring top 50 tech news podcast, there are affordable options for you to reach our audience and we can support any budget.
[00:00:42] Podcast listeners are more engaged, have a higher level of brand retention, and are more willing to listen to ads here than any other avenues.
[00:00:51] Want to know more? There's information at mspradio.com slash engage, including a button to book a time to talk. I'm looking forward to that discussion. Well, Peter, welcome back to the show. Thanks, Dave. Thanks for having me on. Always great to talk to you.
[00:01:10] We should call it Christmas in July because we see the reports always come around mid middle of the summer. And so for those of us data nerds, it really is that sort of that Christmas time.
[00:01:22] That makes me both excited about how happy you are to get our annual profitability report. It also makes me worried about your childhood and how you celebrate a Christmas if this is Christmas like for you.
[00:01:34] That's almost another podcast for all of the stories there. In particular, like the timing is really good because anybody who started will be gearing up for year end planning and then you've got the inputs for that.
[00:01:47] And I'm going to dive right in because there's a bunch of data points that I kind of wanted to ask about because it felt like this year's data set had some new sections.
[00:01:57] It had some new insights and some stuff that you had done before. And I really wanted to get some thoughts on that. The first one I'm going to start with is there's a correlation between customer satisfaction and financial performance.
[00:02:09] Talk to me about what you found here and what you found most interesting. Yeah, we've been talking about this for a couple of years and you're right. There's several new special sections.
[00:02:19] Our process every year is we have some of the same stuff that we cover every year. We do a review of each of our, or most of our business models that we benchmark.
[00:02:31] Seven of the ten business models have sections and so we go through and we update that. We update some valuation numbers in there and some of the things are standard every year. They're interesting every year. They tell a story, but they're consistent from year to year.
[00:02:45] What changes in the report is every year because we write it, we get to look at what are the things that we're finding kind of interesting in the market right now and what are the things that we're intrigued by.
[00:02:56] And so every year we do a deep dive on those and see how they play out. One of those things we've been talking about for a couple years was exactly that.
[00:03:05] And that was service leadership has long argued that the highest profitability customers not only are the most profitable, but they're the happiest customers.
[00:03:16] They're delivering a higher degree of quality. They're charging the most, but even though they're charging the most and their customers are paying the most, they're also the happiest.
[00:03:24] And so we had some attrition data that already was available to us to corroborate that, but we really wanted to go deeper and look at some more nuance on it.
[00:03:35] So we pulled a pretty large data set of net promoter score data from our sister company SmileVac and we were able to correlate that with profitability.
[00:03:45] And so what we found was at a high level, best in class were in fact, they did in fact have the happiest customers. Their customers NPS was about a 65, bottom quartile was around a 50 or so.
[00:04:03] So overall the industry is pretty good, but definitely the best in class had the highest correlation to profitability and to customer satisfaction. Customer happiness. But what was really interesting was when we went a layer or two deeper.
[00:04:20] So we looked at it when you're looking at best in class profitability, that's looking at the totality of the profitability of the business. We decided to go look at just service gross margin and say, based on is there a correlation between net promoter score and service gross margin?
[00:04:39] And that one was, I think the most interesting for me.
[00:04:43] I know there's some other ones that others have found interesting, but for me, that was the most interesting because what I found was that as you know, net promoter score, bottom end score is negative 100 and top end is plus 100.
[00:04:57] So really good net promoter scores are in the 50, 60 range. That's where you see companies like Costco and Apple, others. What we found was anybody that had as negative 100 to a zero NPS, they had the lowest service gross margin. It was really, really low and that's not surprising.
[00:05:20] Those are probably very chaotic MSPs delivering very poor quality service. They're probably picking up bottom feeder customers. They're charging a lot less. So all of the things that drive low service gross margin, so inefficiency, et cetera.
[00:05:39] As you started to improve it, so as you got to zero to 10, service gross margin started to improve a little bit. But when you got to 10, this range from 10 to 60 was about the same. It stayed up there.
[00:05:55] So the sweet spot for NPS was somewhere around that 30 to 50, I believe. And after what was really interesting was after 60 NPS and higher service gross margin actually came down.
[00:06:10] And so if you think about why, well, if a 60 is a good score in NPS, how do I get to a higher score? Well, one way I can get there is I can do the car dealer thing and I can coach you.
[00:06:22] But assuming I'm not coaching you and I'm asking for a really objective score, how do I get to an 80, 90 NPS score? Well, I can do things like I could hire all level three techs from my support center. Every phone call gets answered by a level three tech.
[00:06:42] My customers would love it. They'd be really happy. There'd be less escalations. First call resolution would be higher, et cetera. But it would also break my profitability model. I mean, there's a level where you can't charge enough to make up for some of those kinds of cost decisions.
[00:07:00] So the point of it was if you're going to go for really, really high NPS scores, the 70, 80, 90 stuff, you've got to be able to charge for it or your service gross margin is going to take a hit.
[00:07:13] The second point is it doesn't necessarily mean that those providers are less profitable. They could still be best in class, but they're going to have to give up costs somewhere else.
[00:07:24] So let's say I have a 90 NPS score and I'm staffing in a way that's driving lower service gross margin. I'm doing things that are driving lower service gross margin, whatever those things might be. Well, OK, if that's the case, I should be getting a lot more referrals.
[00:07:40] I shouldn't need to spend as much money on marketing. I may not need to spend as much money on sales. Maybe I'm cutting back and I'm more efficient on my GNA spending. Whatever it is, you can't have it both ways.
[00:07:56] You can't have lower service gross margin, be doing really crazy stuff to drive CSET and spend as much money on sales, marketing and GNA and be as profitable. Something's got to go.
[00:08:09] Gotcha. Now, the other area that I was immediately drawn to was the fact that it's not quite obvious that private equity versus non-private equity, like there's an obvious choice of performance because in some cases, like there's goods and bads on both sides.
[00:08:24] Talk to me about what you found most interesting in that difference between private equity backed MSPs and their peers that are not. Yeah, our data shows that there's a lot of difference.
[00:08:35] Yeah, our data show that the private equity backed MSPs had higher NPS than the non-private equity back. We also have a slide showing the correlation to size of company. So there's a sweet spot in there that I believe was around the 25 to 50 million maybe
[00:08:54] where NPS was higher, where you had it. So presumably there's a fair number of private equity backed folks in that size range. And so there's some degree of fluctuation based on size ranges, but generally speaking, they were higher in our sample. So it makes sense.
[00:09:12] I mean, I think that what we're seeing with a lot of the private equity folks now is they're really good operators that they're doing acquisitions and they're integrating better than they were maybe five years ago. And they're starting to show the results of those.
[00:09:26] So we've definitely seen the impact on that model on profitability. But so seeing it on CSAT wasn't entirely crazy. Gotcha. And the other area you really dug into, and for me, it was the first time, was looking at the financial performances by geographic region.
[00:09:41] Was there anything really surprising to you there or things that stood out? It wasn't really surprising. I mean, I think the biggest takeaway was there's certainly differences in geos. North America, we've believed for a while is about three years or so ahead of the US.
[00:09:59] Of Europe in terms of operational maturity level, probably even a little farther ahead than Australia, New Zealand. So we see some differences in operational maturity level between the geos. Those differences translate to some differences in profitability.
[00:10:15] But when you really break it down and look at it, Europe's doing pretty well. Those MSPs are growing. Australia, New Zealand is a bit behind. And that's exciting. If I'm an MSP in one of those geos, I know what works now.
[00:10:29] And I know where we can go from here to there if we do some things right. And so I think the story there is a really exciting one as well.
[00:10:38] We are trying to service leadership the last couple of years has been really trying to provide some more nuanced geospecific data, mainly because they've been asking for it.
[00:10:48] There are some macroeconomic issues that are different in Europe than they are in the US or in Canada or Australia, etc. And so those providers, they want to know that the data that they're seeing is as relevant as possible. And historically it has been.
[00:11:06] The ratios that work in the US work in Canada, they work in UK and they work in Australia. But that being said, being able to provide a view that shows some of the local nuances I think is really interesting
[00:11:19] and it's really valuable for the companies in those regions. We've even gone so far, our new SLI platform, Service Leadership Index, our benchmarking platform, we've added local currency symbols in there. So now when those providers enter in their local data in pounds, for example,
[00:11:36] they'll see it in pounds and they'll see the output in pounds as well. But one of the big things that it did sort of show was that the fundamental basics of the operations of the business are not that different.
[00:11:46] There's always that discussion of, well, in big metro centers you can charge more or lower rates of labor in smaller business. And it looked like from my perspective that the report essentially says, no, that stuff isn't the actual important data.
[00:12:03] Is that a correct way of looking at it? That's 100% correct. So the slide that I think I'm most excited about in the whole report is the slide that shows profitability based on revenue size. And that's a new slide that we added this year.
[00:12:21] And so we looked at revenue sizes of MSPs. We also looked at the geo differences and we looked at what percentage are best in class and what percentage are bottom quartile. The reason we did that is exactly what you said, Dave.
[00:12:34] And that is when I go into a room full of MSPs and talk to them, whoever's bottom quartile will typically tell me something along the lines of, well, I'm X size. Once I grow to be Y size, then I can be best in class.
[00:12:51] But for now, whatever reason, if I'm a small MSP, I don't have sales engines. I don't have a marketing engine that's big enough. I don't have scale.
[00:13:01] If I'm talking to a large MSP who's not doing well, their belief is if I was smaller, I could be more nimble. I want to have the overhead that I have, et cetera.
[00:13:14] So generally speaking, whatever size that individual is who's not doing well, their belief is the grass is greener in some other size range. So we ran it. We ran the data. And the same thing holds true between rural and metro areas, between different parts of the country.
[00:13:34] If I talk to the guys in New York, those guys think that with the cost of labor and cost of overhead, et cetera, they can't make money. Excuse me. If I talk to rural folks, they think there aren't enough customers, so I can't charge enough out here.
[00:13:50] Well, yeah, you're going to charge a bit less, but you're also going to have a bit lower cost of labor. So your service gross margin ratio should be, they should be the same. Your service multiple of wages efficiency ratio should, they work the same.
[00:14:08] So all of it comes out in the wash if you're running your business right. And the data really showed it. That slide that shows based on sub-million of revenue, one to three million, three to six, six to 10, 10 to 15, 15 to 25, 25 to 50 and greater than 50 million.
[00:14:26] In each of those sizes, at least 21% was best in class. At least 21% was bottom quartile. So there were some nuances between the sizes, but the point was, I don't care what size you are. I don't care where you're located.
[00:14:40] If you run your business right, you can be best in class or you can decide to be bottom quartile as a MSP owner. It's entirely your decision. It's funny because every time when I would travel, attending conferences and talking to MSPs, the number of times I was told,
[00:14:57] well, Dave, you just don't understand our market. And it would either be the difference between going into a rural area or another country. And you're exactly right. The data doesn't show that. So I've had some of my favorites.
[00:15:08] What was the most surprising finding for you in this report and why did it intrigue you? Dave, that's a great question. I don't know that much surprises us anymore. When we're looking at the data, we see stuff, we see it all day long.
[00:15:25] But there's a lot of really exciting stuff. One of those was the one I just talked about with the opportunity that's there for all different sizes of businesses. I think that's really important because we're still an industry dominated by the sub $5 million MSPs.
[00:15:41] The mean is about seven and a half million today. But part of that is because we're seeing a lot of larger MSPs today compared to where we were before. About 60% of MSPs are still in that smaller size range.
[00:15:56] So knowing that there's a profitability opportunity for those MSPs and that they can continue to grow, etc. is really important. But not really much surprised me, I would say. I guess if I was going to say anything surprises me, it's not so much just this year's report.
[00:16:18] It's that what the data showed is that this is the fourth record year for the industry. That we're in this golden era for the industry. And what's surprising to me about that is more upon reflection.
[00:16:30] When I think back to when I was running a large MSP in early March of 2020, and we're doing management meetings, emergency management meetings to brainstorm at the beginning of COVID. How well positioned are we on cash? Are we going to be able to survive this?
[00:16:53] Will any of our customers still be around in six to 12 months? Will this industry exist after the decimation that's going to be hitting us economically? All of these worst case scenarios that all of us were staring at in early March of 2020.
[00:17:10] To know today, looking back, that we'd have the best four-year run ever for the industry. That's probably the most exciting thing about all this is we're in such a great time for the industry right now. It really is definitely an interesting time.
[00:17:26] And I'm going to dive a little bit into the age of companies. You've got a lot of really great information in the report around the fact that 31% of providers are founded 30 years ago or more. You've done a ton of looking at succession.
[00:17:39] But I want to talk a little bit more about the emergence. One of the other things that was striking to me was not only are we on this four-year run, we're actually on a multi-year run.
[00:17:48] And by my quick math, it's seven issues with growth of newly established providers. What are you finding in that look around that newer provider space? Are they outperforming? Are they growing faster? What did you look into there on the new ones?
[00:18:06] Well, every startup has to start up as a startup. So say that three times fast. But when you hang a shingle and start your business, you're going to have to go through the OML progression.
[00:18:19] You start out as a startup and have to get customers in and be less discriminatory about who you're bringing in as new customers and just try to get some revenue in the door and all of that stuff.
[00:18:31] What we're seeing with a lot of the smaller MSPs that are starting today is a lot of them are starting now with an established base of knowledge about what works in the industry that wasn't there 10, 15 years ago.
[00:18:45] When we were all in the early days of the managed service business in 2010, 2011, and really just trying to figure out the model, today that's not the case. The model is well-established. I know what my gross margin should look like. I know what my efficiency ratio should look like.
[00:19:05] I can build this thing in a way very deliberately out of the gate that's going to drive better performance. And I'm not going to have to go through five years of the school hard knocks to get there.
[00:19:17] I'm still going to have to get some customers in and get established and get some employees. And that's always a really difficult stage in a business. But once I do that, I can advance much, much faster.
[00:19:30] And so we're seeing that not only are a lot of folks starting out who have that knowledge base, but part of the reason why is because of all the M&A. You're seeing a fair number of folks go out there who maybe didn't own the last MSP,
[00:19:44] but maybe they were an executive there or a senior manager or whatever. And after their time is up at the new business, they leave and they start up and decide that, hey, we know how to run this thing. We know how to build one of these.
[00:19:58] Let's go start our own. And so our industry is one that's not capital intensive. It's knowledge intensive. Knowledge is the barrier to entry, not capital. So we think we're going to continue to see this going forward.
[00:20:14] It's very similar to law or accounting or others where you're seeing massive consolidation at the top. You're seeing law firms now that are truly multinational, massive, massive law firms. At the same time, every day, attorneys are going out and starting their own firm.
[00:20:31] So we think that cycle of life will continue. Well, so Peter, one of the things here is you guys looked at the different models and you gave a little sense of the fact that there are different ways of growing a business, different ways of adding additional value.
[00:20:47] Most managed services providers, which are actually starting to take up a bulk of the industry, might immediately say, well, ours is clearly the best model. But when you dug into it, the value creation isn't quite that clear cut.
[00:20:59] And there's actually some really interesting stuff, particularly over on the time and materials side. Can you give us a little bit of what you found there? Yeah. So the data that you're looking at, we looked at the size of EBITDA dollars.
[00:21:13] We looked at the five-year improvement, the CAGR, compound annual growth rate. We looked at EBITDA percentage. We looked at the five-year change in EBITDA percentage. So is it going up or down? We looked at MRR as a percentage of total revenue and the five-year change in that.
[00:21:32] And we looked at valuations using our approximate valuation formula. And so what we found was that managed services was actually the number three out of six. Number one was infrastructure technical services, also known as break-fix. Number two was project services. Number three was managed services.
[00:21:52] So that being the case, I would read that data from an interesting and entertaining perspective. If I'm a managed service provider, I would not make any business decisions based on that for a couple of reasons. Number one is it depends on when we started the five-year CAGR.
[00:22:13] And so if you were having a down year five years ago, your compound annual growth rate is going to look better as a percentage. And the MSPs have been pretty consistent over those five years.
[00:22:26] Number two is there's a much, much higher degree of fluctuation of success for infrastructure TS firms and for project service firms. That those firms, particularly project service firms, do really well when the economy is expanding
[00:22:44] and when companies have a lot of extra money to spend on project work and they're able to keep their engineers fully utilized, et cetera. Managed services over time is a much more consistent business model.
[00:22:58] So if I own an MSP, I should not be looking at this data and saying, you know, if I really want to do better, the way that I should get better is to move to being a project services firm or being a break-fix firm.
[00:23:13] But the point of the data is that you can do well in any of the different PBMs, but there are certainly some differences between PBMs. Well, I want to get your take on it because I took away kind of two key insights.
[00:23:29] The first was is that I want to make sure that we have a conversation around sort of, you know, that technical services, transactional IT. And we look at it, we observe that, you know, oftentimes the industry is quick to be judgmental and detrimental on those spaces.
[00:23:47] And they are actually viable businesses that are then to point two are part of a healthy mix. That oftentimes you want to have not just managed services, but you want to be implementing project services.
[00:24:01] There are times you want to do some transactional work with your customers or expand using it. And in fact, that the best providers are finding healthy mixes of all of that. What's your reaction to that premise?
[00:24:16] Well, yeah, certainly if I'm running an MSP, I have at least 40% of my revenue coming from services. And my largest bucket is from infrastructure services. My largest bucket within that is managed services. That doesn't mean I'm not doing project services.
[00:24:34] That doesn't mean I'm not doing some billable non-project tickets once in a while. The key is understand what drives success in your business model throughout the totality of your business model. So if I'm an MSP, it's really important that I not only be doing projects,
[00:24:50] but that I'd be doing them in a way that's going to maximize my service gross margin. We did a whole section in last year's annual report, which you'll probably remember,
[00:24:59] that talked about the decline of project service gross margin and the impact it was having on overall service gross margin for MSPs. And so, yeah, definitely you're going to be, you want to be, you want to, your main business model is managed services.
[00:25:16] So you've got to run a very efficient and effective managed service delivery operation. It's got to be priced right, et cetera. But don't lose sight of the other sources of revenue for your business. Make sure that you're doing projects really well. You're maximizing your gross margin there.
[00:25:34] That your product gross margin is not being overlooked. That's a significant source of profitability leakage for a lot of MSPs is they're underpricing their products. So you want to look at the totality of the business. But if you are running a break-fix provider,
[00:25:53] your largest infrastructure revenue source is technical services or non-contract, non-project billable tickets. So break-fix, there's a viable business there, but there's a reason that most of those folks have been transitioning over the last five to 10 years to MSPs.
[00:26:14] There's a lot of reasons why one of those is MSPs are much more economically resilient. You have a much higher percentage of your revenue contracted. It makes it a lot easier to staff your business, to deliver consistent profitability. And it's a lower stress business.
[00:26:32] If you're going to run a break-fix business or even a project shop, better have your cardiologist number handy because you're going to need it. Those are viable businesses, but they're also much more difficult businesses over the long haul. Gotcha. So you've been spending time with the report.
[00:26:51] People are asking you kind of a lot of questions. What are some of the top one or two recommendations based on this year's report that you're giving out to providers? Number one is understand the opportunity that Best-in-Class provides.
[00:27:05] Understand if you're a provider, what those gross margins look like. Understand how to get there and what the difference is. The historical, if you go way back, we have a slide in there that shows the difference in profitability over time between Best-in-Class and Median.
[00:27:24] Not just, everybody thinks about the delta between Best-in-Class and Bottom Quartile. But if I can go from Median to Best-in-Class, our data says that over time, you're going to be performing at 2.5x the profitability. That there's just a massive difference.
[00:27:42] So understand what it would take to get from, if you're Bottom Quartile, to get to Median, if you're Median, to get to Best-in-Class. And we have a ton of data in there, again, covering multiple different businesses models that will help you understand what that looks like.
[00:27:56] The takeaway from it too is read the special sections. One special section we didn't talk about was implementation of hyperautomation and some best practices with that. We think this is already, we're in the early stages now, but this is going to be really transformative for MSPs.
[00:28:15] And we have a whole section in here on how to really get going and kick it into gear in a way that's going to deliver best outcomes. Best-in-Class results for you as a business. Well, there's the tease.
[00:28:27] If people are interested in learning more, where can they get the report? You can go to service-leadership.com. We actually have the report at 30% off right now. And we'd love to get it into your hands and 350 pages of light reading for you on your summer vacation.
[00:28:44] Oh, that's what everyone looks forward to for their beach time. Peter, this has been great. Thanks for joining me today. Yeah, thanks Dave. Thanks for having me. The Business of Tech is written and produced by me, Dave Sobel, under ethics guidelines posted at businessoftech.com.